
A greenhouse gas (GHG) inventory, commonly known as a carbon footprint, estimates the greenhouse gases your company is responsible for each year. When it’s ready, you receive a number that tells you how big your emissions are (in tons of CO2e). That number is broken into scopes: Scope 1 is what you burn, Scope 2 is the electricity you buy, and Scope 3 is your value chain (see footnote).
Unless you know the methodology, that number is hard to act on. The real value is in the data underneath it, which can sharpen your operational metrics and your decisions.
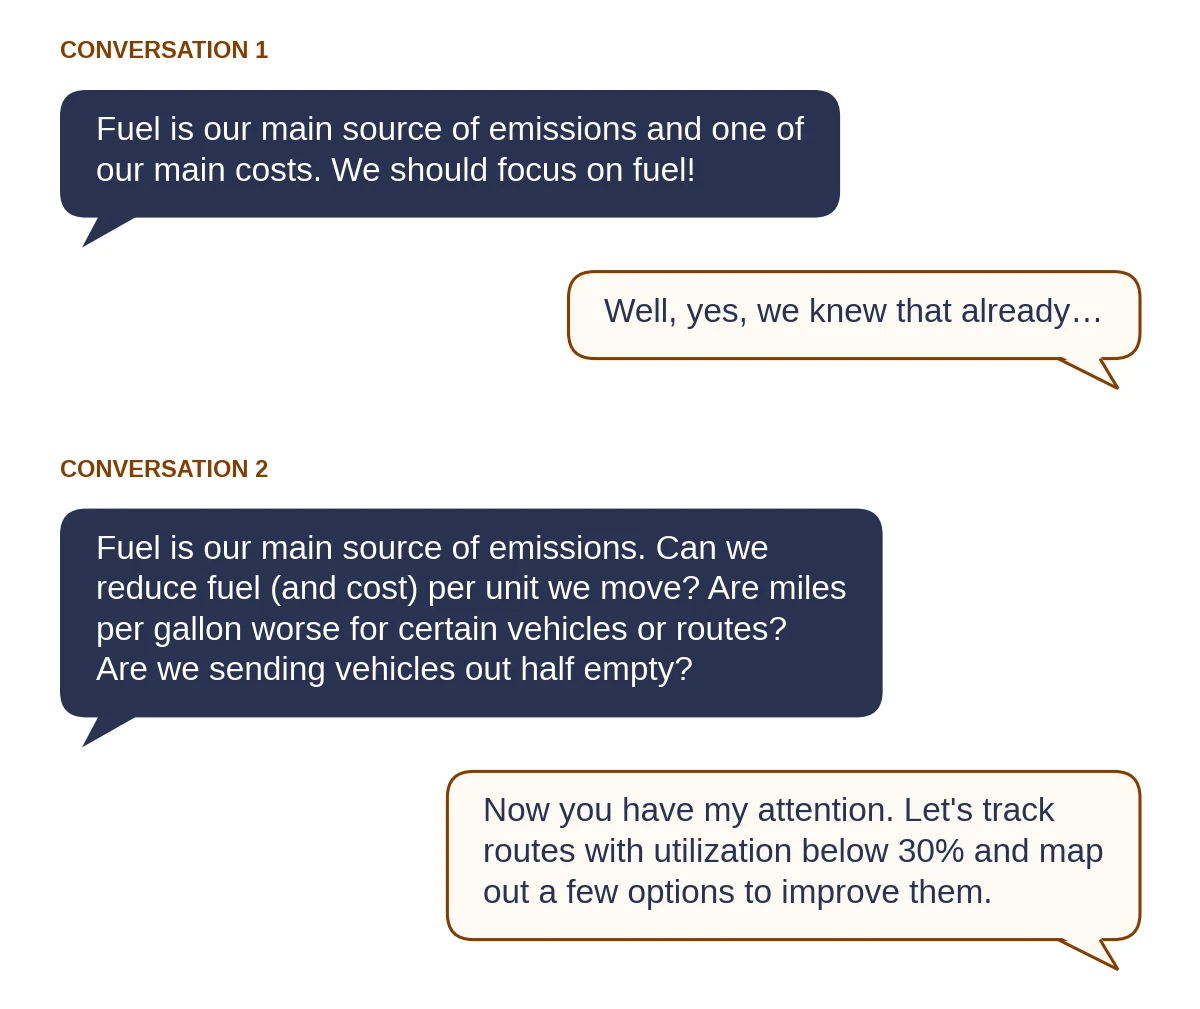
Consider these two conversations:
A good inventory is complete: it covers every relevant activity within your company’s boundaries, following the GHG Protocol Corporate Standard. That doesn’t mean your plan should target every line item. Instead, narrow it down to a few focus areas: the categories where action matters most. It takes four steps: find your focus areas, sort them, look for opportunities, and set metrics.
Find your focus areas
- Pareto: A few categories usually drive most of your emissions (the 80/20 rule). Find the sources that make up 80% of the total, then list the biggest three to five.
- Spend and spend volatility: Where do you spend the most, and which costs have jumped with volatile prices? Expect overlap with your Pareto list. That overlap confirms your focus areas.
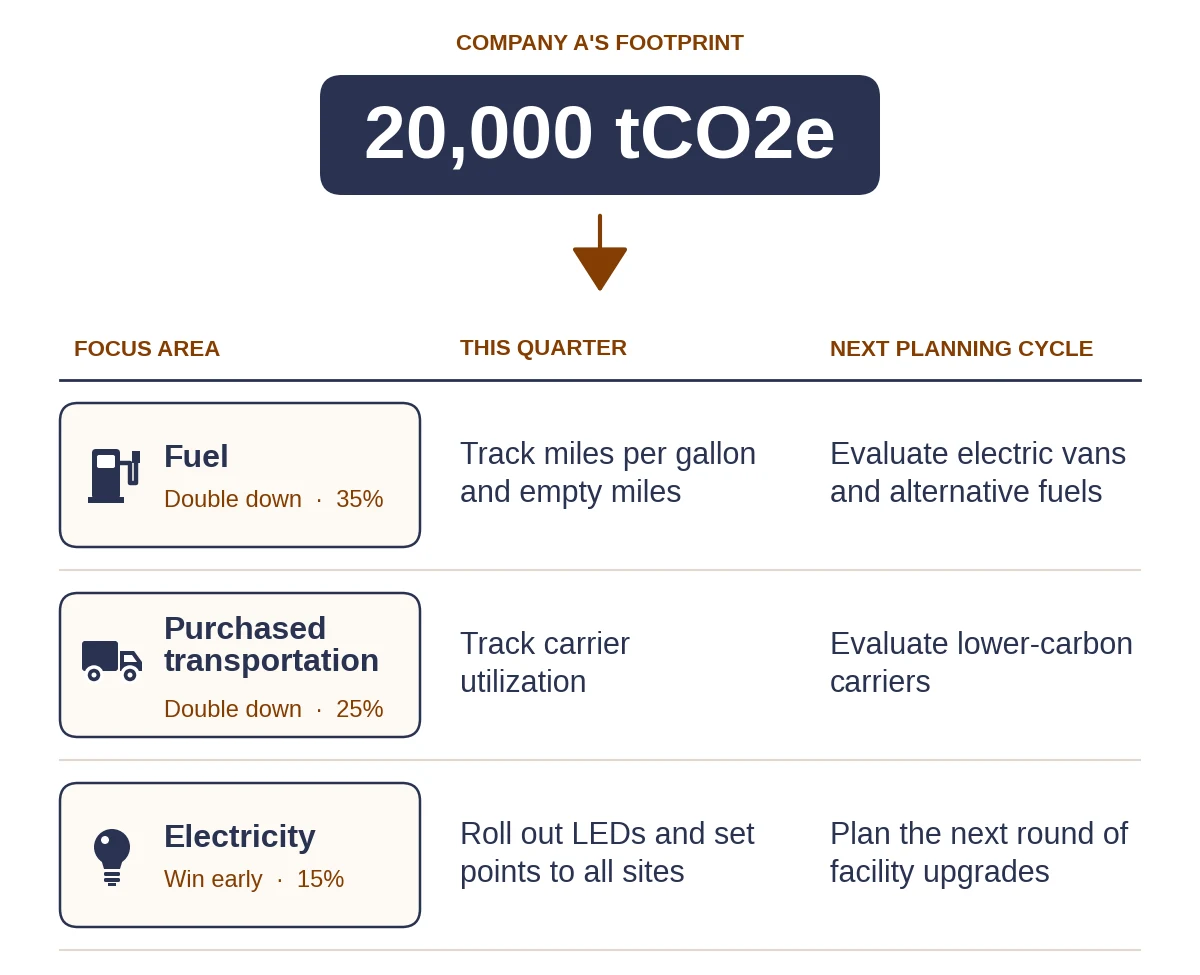
To illustrate, consider Company A, a third-party logistics (3PL) provider operating five warehouses and 100 delivery vans. Company A’s emissions inventory is 20,000 tCO2e. Pareto shows that fuel, purchased transportation, and warehouse electricity make up about 75% of its emissions. Fuel and purchased transportation are also its largest costs. Electricity and refrigerant leaks cost far less, but their emissions impact is large for what Company A spends on them. These four are Company A’s focus areas.
Sort your focus areas
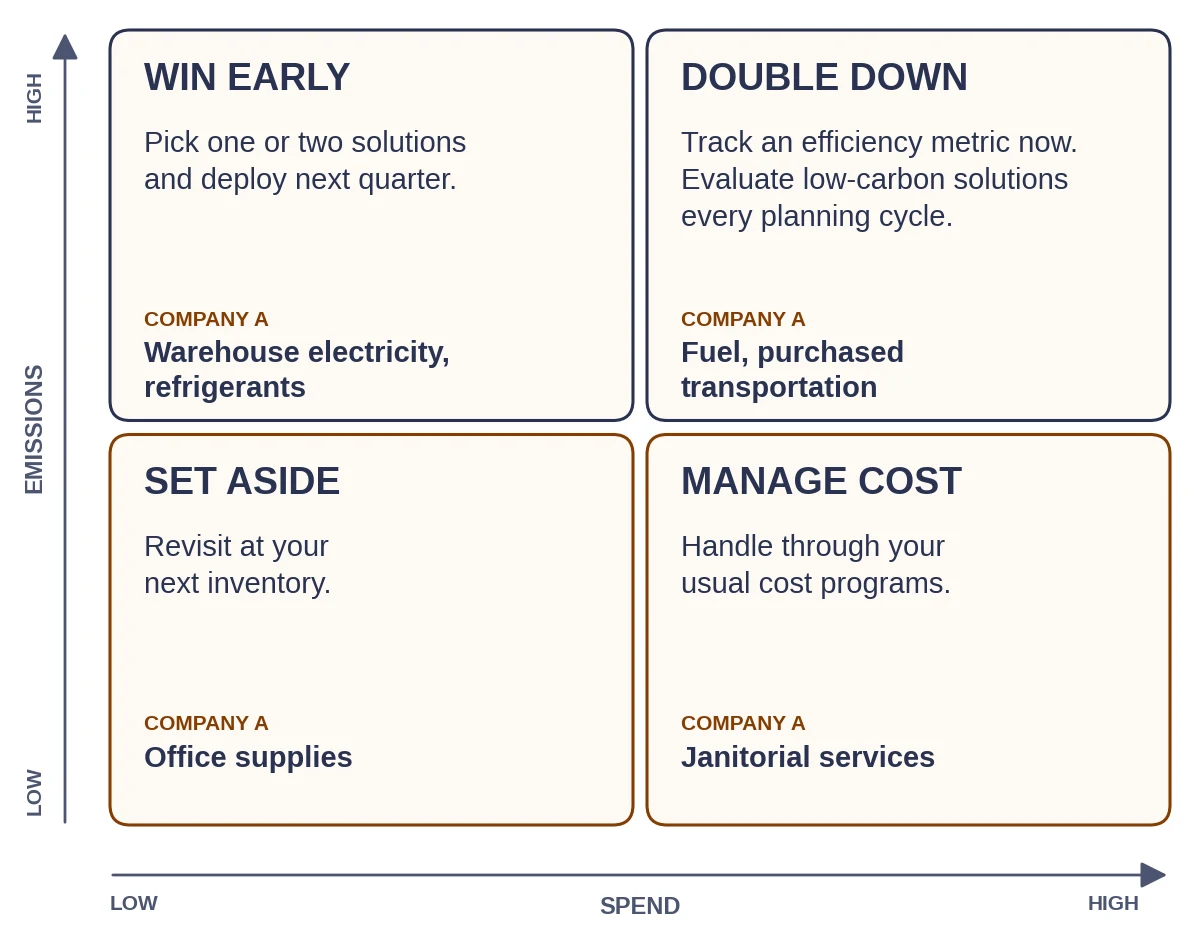
Plot your focus areas on a 2x2 matrix comparing emissions and spend.
- Double down (high emissions, high spend). Start with efficiency: pick one operating metric per focus area and start tracking it next month. Efficiency only goes so far, so also evaluate low-carbon solutions. These usually have long lead times, so revisit them every planning cycle. For Company A, that means tracking miles per gallon now and evaluating electric vans, alternative fuels, and lower-carbon carriers in annual planning.
- Win early (high emissions, low spend). Solutions here are often affordable and quick to deploy. Pick one or two and implement them next quarter. Early results build momentum and confidence. For Company A, that means cutting warehouse electricity use and refrigerant leaks.
The other two boxes need less attention. Manage cost (low emissions, high spend) through your usual cost programs, and set aside (low emissions, low spend) until your next inventory.
Find opportunities using two lenses
Now look across your focus areas for two more kinds of opportunity:
- Scale up (solutions already working). Find low-carbon solutions already working somewhere in your operation and expand them to other sites in your next planning cycle. If you don’t have any yet, pilot one in a Double down focus area. It becomes next year’s scale-up. For Company A, that means expanding its electric yard tractors beyond one site and bringing the LED lighting and temperature set points that cut one warehouse’s energy bill to every warehouse.
- Choose clean (planned investments). Look at big changes already on the calendar, like replacing older vans or opening new warehouses. If they touch a focus area, evaluate cleaner options before you buy. Choosing cleaner technology from the start is simpler than retrofitting later. For Company A, that means evaluating electric vans before its next replacement purchase and specifying low-impact refrigerants for new warehouses.
Turn focus areas into metrics
Your footprint is updated once a year, which is too slow to manage a business. For each focus area, pick one or two operating metrics that drive its emissions and assign each to the team that controls it. Examples:
- Fleet: empty miles %, miles per gallon, vehicle utilization
- Facilities: kWh per unit shipped, refrigerant leak rate, water spend, waste spend
- Packaging: packaging weight per order, package dimensions vs. product dimensions
Then set targets for rolling out low-carbon solutions:
- Fleet: % of loads completed with an electric vehicle
- Facilities: % of warehouses with LED lighting
If these metrics improve, your emissions will follow, and you won’t have to wait a year to find out.
A note on data quality
Many GHG inventories start with spend data. That’s a fine starting point, but it limits your ability to track progress, because spend-based emissions move with prices, not with what you do. When fuel prices spike, your spend-based emissions go up even if you drove the same miles. When prices fall, they go down even if you drove more.
For your focus areas, part of the plan should be replacing spend data with activity data (gallons, kWh, tons) or supplier-specific data. Otherwise, the real reductions you make won’t show up in your numbers. Better inputs lead to better decisions.
From one number to an action plan
Remember the two conversations about fuel? The first one stops at what you already knew. The second one turns the same data into questions, metrics, and next steps. That’s the difference between having a footprint and using it. Start with the few focus areas that matter most, match each one to the right timeline, and give your teams metrics they can own. Look for solutions you can scale up and big purchases where you can choose clean before they’re locked in.
Your inventory doesn’t need to be perfect to be useful. It needs to drive decisions. And the best time to make those decisions is before next year’s plan is set.
Subscribe to Unpacking eComm for more practical guides to scaling operations with confidence.
Footnote: Scopes 1 through 3
A GHG inventory groups emissions into three scopes:
- Scope 1 covers direct emissions from sources you own or control: fuel burned in your vehicles, natural gas burned onsite to heat your warehouses, and refrigerant leaks from the equipment that keeps your inventory cold.
- Scope 2 covers emissions from purchased electricity that powers your equipment and electric vehicle chargers.
- Scope 3 covers indirect emissions across your value chain. Upstream, these come from the vendors who make the goods and provide the services you buy. Downstream, they come from what happens after products leave your hands: transportation you don’t pay for, how customers use them, and how they are disposed of.
Reference: GHG Protocol Corporate Standard